Wednesday, December 21, 2011

REIWA - Mouthpiece Confirms Perth House Prices falling at $2300 Per week.

As most readers would know I often comment on Perth Now property page. Recently I said the following:

(See link Comment # 11: http://www.perthnow.com.au/business/buyers-saving-pennies-hurting-property/comments-e6frg2ru-1226227616062 )


I assert the following in the above posting on Perth Now:

1)That REIWA Says Perth Prices are falling at $2.300 per week
2) That REIWA Says prices will keep falling till the middle of 2012.

REIWA "Communications Director"  (Just a Glorified Mouthpiece)
took exception to what I had to say & posted the following in comment #42


REIWA assert the following in the above Posting on Perth Now 

1) That REIWA does "not" say house  prices are falling at $2,300 per week.& That it simply isn't true.
2) That Indications are that the median has bottomed.
3) That REIWA anticipates a flat 2012.

So I guess the ball is now in my court to prove my credibility so here we go:

Are prices falling at $2300 per week & did REIWA say this. 

Yes to both look at the extract below from a REIWA publication 
 {http://reiwa.com.au/adm/Reiwa%20Magazine%20Panel/MarketUpdateNovember2011.pdf}
It clearly states that June 2011 Qtr Median house Price was $480K & the Sept 2011 Median Price was $450K a drop of $30K divided by 13 weeks in the Sept 2011 Qtr gives you prices falling at $2,307.69 per week. Sept Qtr is the latest official data published by REIWA.
This data says that what I say is 100% accurate Perth house prices are falling at $2,307.69 per week & it is REIWA's own data so in fact REIWA are saying it with their own data.


REIWA then makes the assertion that indications are that the Median has Bottomed:

The extract below from Landgate (22-12-1011) currently shows that Median prices fell further in October 2011 contradicting REIWA's assertion that prices have "BOTTOMED"  in fact Median prices fell further. So I put this up as proof REIWA are wrong when they say "Prices Have Bottomed" they clearly have not since putting out their Sept Otr 2011prices fell a 5% in JUST ONE MONTH!! it fell 6.3% in Sept Qtr thats 3 months & indicative data from Landgate says it fell a FURTHER 5% in ONE MONTH!!! how do you get "BOTTOMED" from that?

(Important to note LANDGATE data for Oct is indicative it may show greater falls or perhaps a recovery in prices. Although by now 6 weeks out this number is expected to remain at this rate. The November data is really raw showing a increase in Median which I expect to fall? Time will tell. I will update this chart in a few weeks shown outcomes) 

 Their "Communications Mouthpiece" then goes on to say that "REIWA Anticipates a FLAT 2012"
The problem is the President of REIWA is on record saying  prices will continue to fall for 6 months before recovering mid year. That is not indicative of a "Flat 2012" but a "FALLING 2012" Also have a look at the comment by ANZ Property forecaster in the same article he expects Perth prices to drop to $420,000. He is not that far out because if you look at the previous LANDGATE Data above for Oct 2011 it is already at $425,000. 

As always there is a link for you to check for yourself: http://www.housesmart.com.au/blog/post/Perth-will-begin-to-Rebound-Next-year.aspx 


 So there you go REIWA are wrong 
A) Prices are falling at $2300 per week, 
B) It is True no lies they RIEWA did say what I claimed they said it is there in Black & white in their own data.
C) There are no indications prices have bottomed in fact the opposite is the case with LANDGATE showing further falls.
D) REIWA don't anticipate a "FLAT 2102" their own President is on record saying prices will fall for the first 6 months of 2012 at the very least. ( HELLO 6 months is half of 2012 how can you possibly get "FLAT 2012 from that)

REIWA Communications Manager - Mr Brian Greig or "Director of Communications" as he like like to call himself  might like to grab a BIG BOX of These & he is going to need a lot of the stuff to get through 2012.


Remember you can Put Lipstick on a Pig but it's still a Pig!

 
 See Chart below of US House Prices & their rate of decline. US House prices peaked Early 2005 & their house prices started to decline from rates of growth around 17% PA By 2006 their rate of growth had declined to 15% when prices started to fall in earnest. It took almost 2 years for price falls to reach a rate of decline around 10% PA. 

So US house prices reach a peak around 2005 had a period of flat prices then reached price falls of 10% 3 years later. Perth House prices reached their peaks in March 2010 According to REIWA & it has taken just 18 months to reach a rate of decline approaching 10%.

If you look at the US Housing chart below it took 2 years for them to reach a 10% rate of decline. Perth has done it in 18 months we are falling at a faster rate than the US did.

Note: The GFC did not cause US prices to decline they were falling for 2-3 years prior to the GFC. Pretty much the same as here in Australia. We are not in a recession far from it here in WA yet our housing markets are imploding. 


Anyone like to have some fun with REIWA?
Go to their FACEBOOK page & comment on this post & put a link to it as well & watch in 3 minutes it will be removed.

Lets make this REIWA Mouthpiece spend his Xmass break 24/7 looking for the "Dave's" of this world on his Facebook page. Together we can make it a Very Merry Merry Christmas!!


Well done Dave  next time your in Perth I owe you a Lap Dance ':-)


Sunday, November 27, 2011

Million Dollar Makeover or Million Dollar Mistake

Beware of False Prophets

Remember when reading the following to keep in the back of your mind the fact that Sasha had complete control of the project. It was not a property she had to work with. But it was a property that she went out & bought specifically to do up for a profit. It was her own money & choices. All her skills & judgement were at work here selecting the right property & paying the right price knowing the cost of renovations etc so we can now judge just how good Sasha's talent to turn a buck really are. Now remember if she can get it so so wrong with her own money & she had complete control, what faith can you have that you wont suffer the same outcome as Sasha in this market?
 
Back in April 2011 I put up a article about failing Professional Property Flipper Sasha DeBretton 
CEO of home renovating company 
"Million Dollar Makeovers"
(Below is a update that's rather interesting)
Sasha is a great proponent of "Self Promotion" & makes some outlandish claims about her ability to renovate your property in a couple of weeks & add hundreds of thousands of dollars to it's value (If not millions?) But lets just look & see if the claims she makes are all they are cracked up to be. 

Sasha appeared in the following article in this weeks Sunday Times "Home" liftout (27th Nov 2011) 

On her Website Sasha has a link to "Case Studies" of projects she has renovated in the past & she shows how much was spent on renovations & then how much profit was made in the end. Most of her claims of extraordinary profits are difficult to substantiate because there are no names or exact addresses that can be checked & verified. Those that can have not come onto the property market "For Sale" to have their price verified by the buying public. It is very simple to get a Real Estate agent to give a arbitrary price or opinion of what a house might sell for or how much value a makeover may or may not have added, it is a completely different matter actually getting that price in this market.
 

Fortunately one of Sasha's "Million Dollar Makeovers" has come on the market 
#37 Seaward Loop Sorrento
And as luck would have it it is Sasha's very own house. So we couldn't hope for a better example to test Sasha's claims of being able to add Millions of Dollars value to a property even in these "Difficult Economic Times" in fact Sasha goes so far as to claim it is a "Sure Fire" thing.

So lets see how the CEO of "Million Dollar Makovers" went renovating her own home for a "PROFIT"?
# 37 Seaward Loop
Sorrento 
This house was bought by Sasha on the 11th September 2007 
for $2,175,000 now with Stamp Duty of $105,000, $250,000 Renovation Costs & $75,000 selling costs Sasha needs to sell this house for at least $2,600,000 just to break even. So let's see how she went in the real world shall we?


Original owner First Advertised this house for sale 23-05-2007 for $2,500,000.

Property is then Bought by Sasha (Current owner) 
11th September 2007 for $2,175,000
(Talk about timing right at the peak of the Perth property cycle but that's OK because prices only ever go up don't they?)

Sasha First lists this house for sale 20-07-2008  as "EOI"
{ Very Smart Girl waiting 1 year to avoid capital gains taxes but by doing so missed timed the market. House is listed 3 months trying to get $3.5mil price. Clearly nobody willing to pay her target price of $3.5 mil Plus?} 
 
Actual Price wanted finally advertised 18-10-2008 $3,000,000
{Interest rates in 2008 were 9.5% & the GFC has just hit so price reduced to shift the house fast }
Price further reduced to attract buyers 10-01-2009 $2,990,000  
(Another 3 months pass lets reduce it $10K that will pull in the buyers?)

Further Price reduction 28-03-2009 $2.59 mil to $2.89 mil 
(Still No Takers)
20-02-2010 Advertised as "EOI"
(Fishing for buyers but No takers so property rested for a few months.)

Back on the market 6-03-2011 $2,680,000
(Still no takers after 3 months property taken off the market & rested)
Now November 2011 Sasha is coming to her senses & has reduced the price to $1,990,000
Sasha has been holding $2.5 mil debt on this property for close to 4 years. 
However if her strategy  worked all she intended to do was flip it in under 12 months!! 

So now  the interest on this has cost her $700K Plus!! 
Yes she has had a house to live in but she could have rented a house just like this in Sorrento for under $150K for the same period.
So her actual holding / speculation cost has been over $500,000 This is why she needs $2.68mil to try and break even. 
On top of the interest bill she has had to fork out for advertising etc for 3 years of marketing the property.
So what do I think Sasha's property is worth in this market?
Sorry but I would not pay more than $1,500,000 not in today's market!!
Why? 
Well look at this substantially better house listed in Sorrento for 
$1.53 Million: 

A far Far better home that needs no more than 21 days & $1,000 worth of paint from Bunning's.

I like to call this a $1,000 Makover.
Below are Images of Saha's Million Dollar Mistake
Before

 
AFTER
37 Seaward Loop, Sorrento, WA 6020 
 37 Seaward Loop, Sorrento, WA 6020

Friday, November 18, 2011

The Weakest Link

As we all know a chain is only as strong as it's "Weakest Link" & that is true with Property Markets & Property prices.

The "Weakest Link" in the Australian property market is the "Recent Homebuyers" who has bought in the last 3 years. 

The price of all our Houses - Units - Apartments - Land  or Investment Properties are determined by what people have paid for them in recent times as well as the ability of Vendors to be able to wait in the market for their high prices. 

A Vendor having difficulty affording to hold a asset is very likely to slash prices.

If Recent Home Buyers do strike financial difficulties & start flooding our housing markets with housing that they are no longer able to afford to carry the prices of all of our properties will fall.

In the US / Ireland / Spain & UK it was Recent Home Buyers who had bought at the tail end of the  property cycle that drove prices down as they could no longer afford to keep their homes with rising costs of living & interest rates combined with a economic slowdown reducing hours worked & employment.

Most of  Recent Home Buyers in Australia have borrowed to the maximum capacity their incomes would allow. 

They did so at 30-40 year historically low interest rates leaving little room for unforeseen circumstances like reduced overtime,  unemployment , sickness, pregnancy or interest rates returning back to their 30 year historic average of over 10%.

Many of these "Recent Home Buyers" have only managed to enter the home market with the assistance of the Rudd Governments 2008 - 2009 GFC First Home Buyer stimulus handout of either $14,000 or $21,000. 

Prior to these FHB handouts they were not able to enter housing markets because their incomes prohibited them from SAVING a deposit quite simply because their day to day living costs were only just covered by their low incomes & this was when they were renting accommodation at only half the cost they now find themselves paying for home ownership!!. 

Another factor that excluded these FHB from entering the market was interest rates, at a normal interest rate in the vicinity 8% 9% or 10% they did not qualify to borrow enough to enter the market & it was only because interest rates were cut to record low rates around 5% that they were able to qualify for a home loan. 

Banks at the time proudly boasted that they were being  "PRUDENT" by  applying a 2% stress test on a 5% Interest Rate!! 

Oh Please!! ... How much sense would it make to apply a stress test to the 30 year historical interest rate average?

Owner occupiers or investors who bought in 1990, 2000 or even 2005 will have only borrowed a fraction of the amount borrowed by "Recent Home Buyers" so they will be able to cope with the unforeseen relatively easily, however this cannot be said about "Recent Home Buyers" & it will be them who struggle to pay for their houses when rates revert to normal levels of 8% - 10%.

 The ABS have just released a publication that makes interesting reading on the Australian housing sectors.
Below is a link & Extracts from this publication that highlights the point I make. 


This publication presents data from the Survey of Income and Housing (SIH) onAustralian housing occupancy and costs, and relates these to characteristics of occupantsand dwellings such as tenure, family composition of household, dwelling structure, age,income and main source of income. It also includes value of dwelling estimates, and information on recent home buyers.The publication includes a feature article on first home buyers in Australia.

RECENT HOME BUYERS

More than 1.07 million households purchased their dwelling in the three years prior to the 2009–10 survey. These households are divided into first home buyers (40%) and changeover buyers (60%). Most first home buyers were young households with a reference person aged under 35 years (67% ***). Less than 10% of first home buyer households had a reference person aged 45 years and over. In contrast, more than half (52%) of changeover buyer households had a reference person aged 45 years and over.
Note: There are 8.8 million households so 1.07 million  is quite a significant number of households & then add to this the number of new entrants between July 2010 & June 2011 which are not counted here.
*** 85% of this number is under 27 years of age & 60% of this number have ZERO children & are managing to cope because they have 2 incomes. But Women are Women (Sorry to offend) & when the maternal instinct to have children kicks in the expensive house gets the flick or they don't have kids till what 40? 45?.

As you can see from the extract above around 10% of Recent Home Buyers are paying more than 50% of their "GROSS" incomes for housing & a further 26% are paying between 30% & 50% of their "GROSS" incomes for housing.
{It's is also worth noting the 6% of Changeover buyers are now also paying more than 50% of incomes for housing costs}

The Inside banking sources that I know estimate that close to 30% of Recent home buyers are now paying more than 45% of their  "Gross" household incomes to cover "Household Costs" (See explanation of Household Costs in extract above) Furthermore the percentage of incomes to service is growing each year as Property Taxes, Insurance, Water Rates etc increases exceed wage growth.

Remember that is 45% of G*R*O*S*S incomes when you take out taxes well over 55% of Recent Home Buyers incomes are going to cover their costs of housing. 

Quite simply this is unsustainable people have to have money to live "LIFE" & do simple things like have children, take them on holidays, pay for sporting activities, dental care for the kids, health care etc etc etc.

Might come in handy keeping a tin of this stuff in the house if you plan to sell next year.


Tuesday, November 8, 2011

Bank's Spruiking Confidence Returning

 Have a look below at how desperate things are getting at our Financial institutions. 


Item #1 
Housing Loan approvals up?  True statement perhaps but let’s say home loans are down 50% from peaks & then they rise 1% per month for 5 months the statement is technically correct? But is confidence really back if home loans are down 30% -40% from long term historical averages?

Item #2  
Australians intending to buy a investment property has risen to 9%?? 
Well investors traditionally make up 20% -25% of all buyers. 
Talk about putting a spin on bad news. 
In reality they are confirming Investor activity is down 50% if only 9% of Aussies are considering investing in property.  
Just imagine all these apartments coming on the market targeting investors & this bank is confirming demand is down by 50%?

Item #3   
Says 750,000 more people joined the workforce?? 
They fail to mention that the unemployment rate is still higher than before the GFC & hours worked & overtime is down. Most of these jobs are casual or part time employment. Effectively peoples incomes are down 7% -10% on pre GFC levels. Then there is the little fact that rising Power / Food / Health costs have eroded peoples spending power.

This article completely ignores the fact that Retail Spending is down, Land Sales are at Record lows, New Housing Starts are at record lows,.

Just how bad are our markets when financial institutions are resorting to distorting the truth to try & build up confidence in the average consumer so that they go out & borrow money?

Reminds me of the desperate tactics undertaken by the NAR (US equivalent of our Real Estate Institutes) See the attached adverts they put out in 2006 trying to get US consumers to buy houses with their “Positive Spin” Unfortunately anybody sucked in by this spin saw the value of their homes drop 30% to 40%.


 These folks might as well get a box of these & give that a try?


Saturday, October 22, 2011

Overseas Investors Selling Up

A friend of mine went to a property Auction in Connolly  ( Perth Western Australia ) today.


Great house 7 Full Size Bedrooms & 7 Bathrooms, backs on to 18th hole of one of Perth's best golf courses etc etc you get it nothing wrong with the house or its location.

25 Pine Valley Pass, Connolly, WA 6027
Property is 660 m2 built in 2002 has been empty for 9 years. Owned by a overseas investor speculating in the Australian property market in 2002 when our AU Dollar was bouncing around 50 cents to 55 cents US.

{It has been vacant for 9 years never rented or lived in just a property speculation by a OS Investor}

Empty house for 9 years & we are supposed to be having a housing shortage?

Oh please there are thousands of houses just like these scattered around Australia that are about to come out of the woodwork.

This House has been on the market for over 12 months @ $2.3 mil without any offers.

Vendors have been dropping a few dollars every month till finally the owners have read the writing on the walls (Plunge in AU to US dollar values) & put up for auction to get rid of it.

Despite the agents claims of strong interest & fantasy buyers keen to make a offer after auction there were No bids other than Vendor Bids which started at $1.5 mil & dragged on & on  till it was passed in @ $1.7 mil with no bids other than vendor bids. (How embarrassing )

The agent hinted to everyone that a offer of $1.75 mil would get a look in. So effectively the price has dropped by $550K in 12 months & still no sale.

This house is worth no more than $1.2 million in TODAY"S market,

It would have cost the current owners no more than AU$685K {US$350K}to buy the land & build this type of house. {That was the true building & land costs in 2002 before our recent spate of property stupidity}

The important thing to keep in mind was that the AU Dollar in 2002 was around 50 cents to 55 cents so it cost the OS owners only US$350K now with the AU dollar at Par they can afford to sell @ AU$1.2 mil {US$1.3 Mil} & still make a buck.

Very unfortunate for other home owners in the street .
{There were 5 sales in the same street in the last 3 years @ over $1.6 million & all of them were for far lesser houses.}

This overseas owners know that his house might  be worth much less than $1 million in 2012. Then he runs the additional risk of the AU dollar plunging again against the US dollar again if Europe goes "TITS UP" & everyone turns to US dollars for safety.

EG: AU$1 mil @ $1.05 rate = US$1.05 mil....  V's...  AU$1mil @ 90cents rate =  US$900K so his AU$1.75Mil asking price @ a 90 cents exchange suddenly becomes a lot lot less.

These OS investors will be very very keen to sell driving values down for others who bought recently. That's the problem many Australian property owners will face. OS Owners that can still sell at drastic price reductions & still make money whilst they stay trapped having paid too much. OUCH!!

I doubt that even a large tin of this would help. 

Tuesday, September 13, 2011

Bank Fire Sales Have Started In Mandurah WA

Bought Feb 2006 for $1,250,000

Rented out for 4 years for just $500 - $525 per week

Put up for Sale Dec 2008 for $1,500,000

Price reduced over the next 2 years to $1,300,000

Taken over by the bank Jan 2011 reduced to $895,000 no offers for 8 months at this price. Now reduced by the Bank to $799,000 See the Realtors add "ALL" offers considered.

My Insiders say the bank will take $745,000 !!

{UPDATE 24-12-2011 Bank has now reduced Asking Price to $750K hate to say I told you so but I did & that was Sept 2011 FYI my Bank insider tells me they will slash this property to $699,000 2nd week Jan 2012)

Why would they take $745K ??

Well if you look you will see there are 68 Apts in this canal area for sale all at same distressed conditions. 

The owner of this Gem had to sell a property in Woodvale at a $100,000 discount in a attempt to keep the bank from foreclosing.

Be careful judge for yourself but at $745K this is getting close to good value. However I personally would try my luck at $675,000.


Good Luck out There Still be cautious though. {:-)


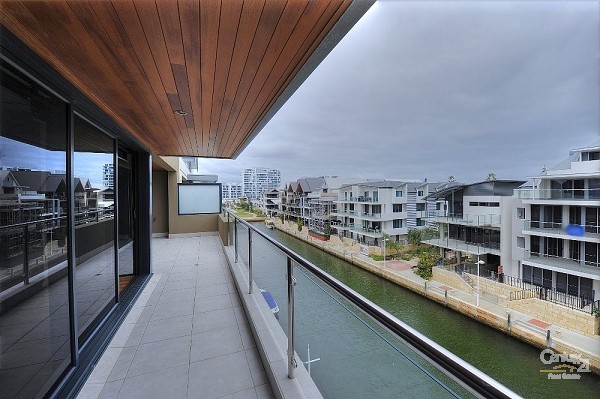
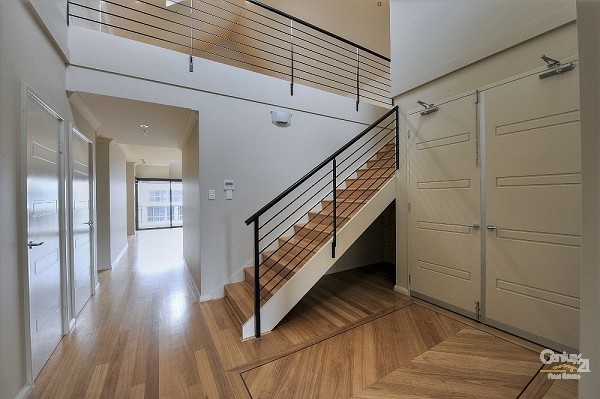
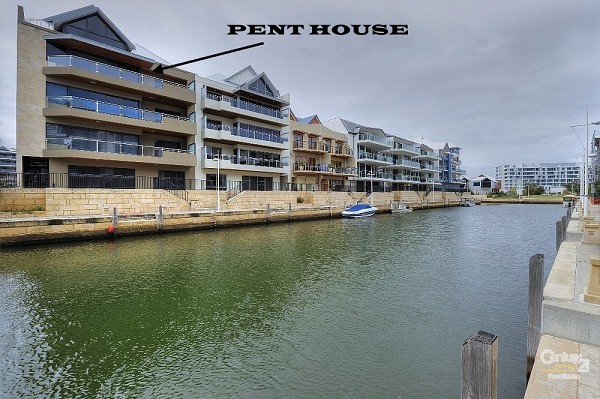
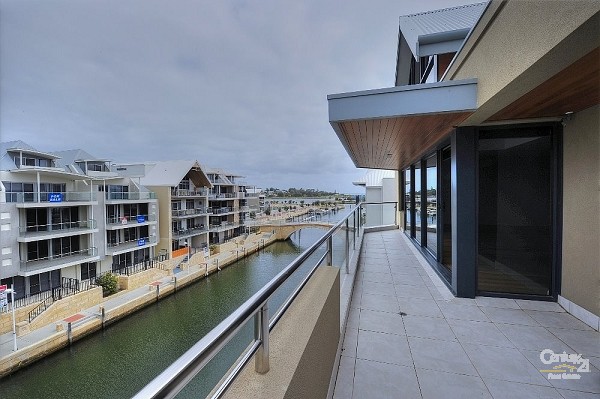
MORTGAGEE PENTHOUSE APARTMENT – MUST SELL

MANDURAH 19C Florian Mews

http://www.century21.com.au/c21/propertysearch/Brochure.cfm?grplstno=WA85427109 


For those who thought that acquiring a Penthouse in the Mandurah Marina was out of reach then think again. We are proud to offer this magnificent two level penthouse with open canal and waterway views. Some of the many quality building features include:

- 3 spacious bedrooms all with built in robes
- Stunning master suite with double vanity
- Masterful Chefs kitchen with top of the range appliances
- Thick granite benchtop and extra storage space
- Open plan living area with full length windows
- 2nd level mezzanine area, perfect for the big screen tv
- Feature light sets the right tone
- Ducted reverse cycle air conditioning
- 2 balconies, one each side for entertaining in style
- Garaging for 2 vehicles with storage room
- Lift and stair access to apartment

Being able to say to your friends that you are off for the weekend to your Mandurah Penthouse? What price can you put on that alone!! This is an opportunity not to be missed.


(LOOK AT THE BIT I HIGHLIGHTED IT IN YELLOW & PRINTED IT IN RED TO STAND OUT> BUT LOOK AT THE DESPERATION IN THE WORDS !!! BARGAIN HARD!!!)

We are under specific instructions to sell 
by the mortgagee and we encourage all offers. 
MAKE YOUR CALL NOW!


19C Florian Mews MANDURAH
 19C Florian Mews MANDURAH19C Florian Mews MANDURAH19C Florian Mews MANDURAH


19C Florian Mews MANDURAH

Saturday, September 10, 2011

Perth Property The Next Victims

Meet property Power Couple Emma Wych a Registered nurse from Armadale Hospital & her partner Spray Painter Aaron Bini. Both were featured on page 37 in a Sunday Times article ( 11/11/2011) Unfortunately their story will be a defining one when property prices crash & burn around them.


They have both decided to take the plunge & buy into property "FOLLOWING A HUNCH" (their own words) that prices will head "NORTH"  {Whatever That means} in the next 12 months. 

They think they have snapped up a bargain  4 x 2 built a year ago for $440,000 (Down from $550,000). However they have failed to notice that the developer of their estate is offering House & Land packages all around them for $330,000 to $350,000 & in a sign of desperation the developers are throwing in a $10,000 "Freedom" furniture package as a sweetener. All around them house listings are growing by the day & vendors are dropping prices to get out of the market, but Emma & Aaron have a "HUNCH".

Now lets look closely at just what they are in for. Emma states that the decided to buy because it was just a "Few Hundred " dollars more than renting (The article fails to state if that is a few hundred dollars more per week or month) Assuming these "Kids" (22 & 24 Years of age) have saved a 10% deposit with FHOG etc ($40K) They would be up for a loan in the vicinity of $400,000 (At 22 & 24 WTF!!)

Currently in Baldivis there are over 20 homes 4x2 "To Let" at under $350 PW so to rent the same house they are about to buy will cost them no more than $18,200 pa. in "DEAD MONEY" (Her words)

Why so many new homes to rent? People can no longer afford to keep them & they are unable to sell them & pay out the bank
.
To buy this house their repayments on a $400K loan @ a 7% rate will be $33,000 pa + Rates/Ins/Maint etc it will cost them at least $36,000 pa or $692 pw (Almost twice as must as renting!!!)

These "ASTUTE" home buyers working on a "HUNCH" think that ownership will only cost them a "Few Hundred" dollars more than renting!!!

Now if Emma & Aaron continued to rent for $350pw & banked $342pw @ 6% (Savings from not buying) in 5 years time they would have over $106,000.

Baldivis is a FHB suburb effected by the slightest movements in interest rates.

In 2008 when interest rates went to 9.5% Baldivis prices plunged by 7.8%, the only thing that saved Baldivis was the GFC forcing rates back down to under 5%.

Many houses that are currently for sale in Baldivs were purchased at the height of the GFC with the assistance of a $21K FHOG & fixed interest rates that were under 5%.These houses were bought by people who could not previously get into home ownership because they could not pay rent & save enough to get a deposit to buy. These people would also never qualify for a home loan when rates were at normal levels because they simply did not earn enough.

Now interest rates are 7% they are having difficulties flooding the market with discounted homes. 

Historically interest rates have averaged over 10% no doubt Emma & Aaron have budgeted for this because it will take their house payments to over $810 pw!!!  But of course that will never happen?? so there is no need to worry about this.

Emma & Aaron will pay a big price for property ownership. No doubt they have plans for that "Big" wedding but how do you save for that & own a home? Well like most couples these days they expect the price of their house will have gone up  & they can draw down on any equity they might have built up. 

Emma & Aaron will also need to put off having children till they are both over 30, because they will have to have the 2 incomes coming in without the additional cost of children to service the loan when interest rates revert to their 30 year historical rate of 10% plus (Psst Kids that's over $810 per week V's $350 pw Rent).

Emma & Aaron can look forward to seeing their friends actually having a life touring the World & Australia instead of being chained to the Great Australian property dream.

But then they might be right & I am wrong. 

Time will tell but I bet they will a big box of this to impress their friends.


The scary bit is that this is what Perth property currently has as it's support base. just imaging how secure your house price is if this is what is sustaining it?

Wishful thinking in Woodvale

4 Olsen Court, Woodvale, WA 6026 


Sales History

Currently Listed for $1,2000,000 to $1,300,000
(Aug  2011)

Listed April 2011 - Aug 2011 for $1,350,000 No Sale Withdrawn From Market
Bought by current owners 2000 for $545,000
Previously Sold 1996 for $480,000

Let me start by saying there is nothing wrong with this house in fact it is great. What I question is the vendors price expectations. 

Perhaps it is unfair to single out this single vendor, but this is just a typical example of our property market in general.

Property listed April 2011 for $1.350 mil well marketed , open by invitation only for the first few weeks because no doubt the agent & vendors thought it would sell without pesky buyers trudging through their house.

Home then opened several times but no buyers prepared to pay vendors asking price.

Property is now listed again after having been rested for a whole 4 weeks. Vendors have spent $3-$5,000 with the first agent trying to get $1.3 mil & can now look forward to spending another $3-$5,000 & 4 months with another agent to get $100,000 less? 

At first glance it would appear the house is well priced when compared to other overpriced houses currently on the Perth property market, if you are buying & selling in the same market it can make little difference so you may wish to consider the house at around it's current pricing.

However a common sense approach to valuing this house puts a completely different value on it.
Applying CPI & Wage increases to determine today's price:

     1996 price ( $480K ) + CPI/ Wages Growth =  $710,000 
     2000 price ( $545K ) + CPI/ Wages Growth =  $765,000

I have no doubt that somewhere out there there is a "GREATER FOOL" who will pay in excess of $1 million for a property that is actually worth less than $800,000. 

Just don't be that FOOL paying  too much in a falling market.


Wednesday, August 31, 2011

Never Believe a Thing A Realtor Tells you!!

Never Believe a Thing A Realtor Tells you!! ...

{ Thanks to Tasmanian Real Estate Trouble for Highlighting the subject}
http://tasmanianrealestatetrouble.blogspot.com/2011/03/heard-it-before.html 

Remember a Realtor has a vested interest in convincing you that everything is OK & now is the perfect time to buy. Because if they don't they Starve!! Just think about this or keep it in the back of your mind when you read stories from Banks / REIWA / RP DATA etc they all form part of what I call "PROPERTY INC" ......

The biggest players in "PROPERTY INC" are Newspapers & property Websites .....  

Property advertising revenue sways what they report & how they report it !!!
  
 In 2006 Sales in the American Real Estate Markets had slowed down & were STAGNATING.

The National Association of Realtors (They are the same as our REIWA or REIA) decided it was time for action. The Mainline Press were no longer reporting the Property Myth as the would like it to be reported. Facts were drowning out the RHETORIC put out by the NAR so they decided to pay millions to put out the MYTH that now was the perfect time to buy property? Really?

In 2006 USA  property was falling & 5 years later in 2011...  80% of commentators were expecting US property prices to fall a further 10-15% .... but this is the PAID ADVERTISING by the NAR  placed in all the major US Papers. ... Why pay? ... Because Newspapers could no longer credibly report the RHETORIC the NAR wanted them to report so the had to resort to PAID ADVERTS??


NAR Campaign Negates Bubble Hype, Encourages Buyers And Sellers
by Blanche Evans  Published: November 3, 2006

{ http://realtytimes.com/rtpages/20061103_campaignneg.htm}

"If you don't tell your story, someone else will," Joe Williams, co-founder of Keller Williams said recently about the media's disinclination to quote real estate brokers as sources for the myriad stories written recently about the so-called housing bubble. Imagine the frustration, ignored by journalists and unable to peddle nonsense to the gullible.

Instead they turn to anyone but people who buy and sell homes for a living -- stock analysts, economists, media pundits, authors, and so on. The effect on buyers has been paralyzing. Many brokers say buyers are concerned with more than rising home prices and interest rates -- they're scared of being the next greater fool. The media turns away from the vested interests to cover the story, balance emerges and the buyers, given a taste of actual analysis and break from relentless spruiking, begin to baulk.

With enormously improved conditions -- interest rates comparable to 40-year-lows and rising inventories that provide greater selection, pending sales are already beginning to rise. Even the former Federal Reserve chairman, Alan Greenspan said he thought the "worst of this may well be over." This could cause many buyers to miss a golden opportunity -- home prices and sales expected to rise again in the spring. Of course things can only get better in real estate land and falling knives don't cause cuts.

Conditions are also improving for sellers. With the number of households expected to increase 15 percent nationwide in the next 10 years, demand will continue. In addition, 2006 has hardly been a failure for housing -- so far, it stands as the third-best year on record. Don't forget the ever-present demand.

Now the NAR is doing something about the negative hype -- running full-page newspaper advertisements in six of the nation's leading newspapers beginning yesterday. The ads are designed to urge home buyers who have been waiting to buy the home of their dreams to act now before the market changes. Not coincidentally, the newspapers chosen -- Wall Street Journal, USA Today, New York Times, Washington Post, Los Angeles Times and Chicago Tribune, are among those most guilty of hyping the housing bubble to the point of scaring buyers to death. The rent-a-quotes became so unreliable, so on the nose, they had to buy their own advertising to con the suckers. 

NAR's first-ever newspaper blitz features the headline, "It's a great time to buy or sell a home." The advertisement points out that interest rates have fallen seven months in a row and are near 40 year lows, inventories of existing homes are higher than they have been in decades and prices have stabilized. But the perfect conditions for buyers are likely to change as sales pick up, prices gain traction and conditions improve for sellers next year. Yep, sales are always likely to pick up, these conditions won't last because buyers will come to their senses (or we'll get our manipulative hooks into them) get used to hearing that one.

"Homeownership is a safe, secure way to build long term wealth. The national median price of homes bought ten years ago, has increased 88 percent," points out the NAR. With prices having risen 50 percent over the last five years, including a longer timeline circumvents criticism that the housing market traditionally only barely beats inflation by a point or two. It's done that and more in the last five years, but keep in mind, that previous to the boom the nation was recovering from a housing slump. Actually, home-ownership proved to be an assured wealth destruction tool with prices down over 50% in some markets since this campaign.

In addition to the newspaper ads, the NAR is blitzing network television and radio with ads directed at buyers and sellers. These begin airing in the second week of January -- the start of the spring selling season in the warmer parts of the country. Pity the fool who fell for this con job.

"The market is much better than you might hear or read," says Tom Stevens, NAR's president. "Consumers should take advantage of this perfect alignment of low rates and extraordinary inventory before market conditions change," Over 4 years later and time is still on the side of the buyer.

And NAR's 1.3 million members and state and local Realtor associations are being encouraged to adopt the message in their own advertising and communications to consumers, beginning with this news:


  • Total housing inventory levels fell 2.4 percent at the end of September to 3.75 million existing homes available for sale, which represents a 7.3-month supply at the current sales pace, according to NAR's existing home sales report.
  • The national median existing-home price for all housing types was $220,000 in September, which is 2.2 percent below September 2005, when the median was $225,000.
  • According to Freddie Mac, the national average commitment rate for a 30-year, conventional, fixed-rate mortgage was 6.40 percent in September, down from 6.52 percent in August.

The time to buy or sell is now. I bet those sellers were damn happy.

0 comments:


Post a Comment


Monday, August 15, 2011

The Great Australian Dream - Just a Dream?

The Great Australian Dream -  Just a Dream?

The great Australian dream for many individuals and families is to purchase their very own piece of Australia.

As our nation grew and prospered through the second half of the 20th century, this dream became a reality for many young families.

Land was cheap, housing was cheap and most of us could afford to buy our very own home.

Home ownership has been supported more recently by ongoing government initiatives such as the First Home Owner Grant and tax concessions available to home owners.


However, in the last decade, buying your own little piece of Australia has become a lot more expensive.

Just 10 years ago, more than 50 per cent of all suburbs in our five major capital cities were affordable but today only four percent are. 

Not a single inner city suburb is affordable today.

Something changed last decade. House prices, not only in Australia, but globally, soared and put the great Australian dream in doubt. Rising prices are seen as a boon for those who already have their own home, but a nightmare for those attempting to get into the market.

The Australian property market truly is a tale of the housing haves and the housing have-nots.

Typically, the “haves” purchased their home many years ago when prices were more favourable. They have since experienced windfall gains through the growth in the price of their properties.The “have-nots” are typically renters, the young (often First Home Buyers), lone persons and single parents.

A decent shelter is a basic necessity for us all and owning our own home the life goal for many. While some prefer the flexibility that renting can offer, the stability of tenure offered by home ownership and the sense of place obtained through owning your own home can be hard to beat.

With house prices outstripping income growth over the past decade, owning a home has become less attainable.

Figure 1 shows that over the past two decades, growth in median house prices across Australia exceeded growth in median household income. During this period, house prices increased by 263 per cent, while after-tax income grew by only 95 per cent.

The difference is entirely due to the last 10 years, where house prices grew by 147 per cent and household income just 57 per cent. In actual dollar terms, the median house price in Australia more than doubled over the last decade - increasing from $169,000 in 2001 to $417,500 in 2011. Conversely, the annual median after-tax incomes for households increased by only half - from $36,000 in 2001 to $57,000 in 2011  (see Figure 1).


So, what’s affordable and what’s not?

A standard rule of thumb for housing affordability is that a ratio of housing costs to income beyond 30 per cent is unaffordable.


Housing stress in Australia

The previous section dealt with housing affordability, in particular, the financial ability of the typical household to purchase a median priced home in Australia. It also demonstrated a serious decline in affordability in Australia over the past two decades. In this section, we take a closer look at housing stress in Australia - the proportion of income that a household spends on housing costs, including mortgage repayments, rent and rates. Housing stress, especially for mortgages, responds slowly to changes in affordability since most households purchased a home many years ago or indeed own their own house outright. Notable exceptions to this group are First Home Buyers.

How is housing stress measured?
 .
Most frequently, housing stress is based on the ratio of individual housing costs to income. Typically, if a household is paying more than 30 per cent of their income on housing they are considered to be in stress. In this report we consider three basic forms:

1. The basic “30 only” rule where a household who pays more than 30 per cent of their after-tax income on housing costs is deemed to be in stress

2. The “30/40” where we only include low income earners - the bottom 40 per cent of income and then apply the 30 only rule

3. The “50 rule” are those in extreme housing stress who pay more than half their income in housing costs

The 30 only rule is often criticised for including rich households who by choice spend a large fraction of income on housing and the 30/40 rule overcomes this problem by restricting “stress” to only those households in the bottom 40 per cent of the income distribution. Both measures have their place.

The 30 only rule includes all Australian households and so better captures “middle Australia”, while the 30/40 rule is better placed to consider the implications for the less advantaged in society. The 50 rule is a simple measure of households paying a seriously large amount of money on housing and potentially at greater risk of default, especially should their economic circumstances change or interest rates increase.
What does it mean to actually be in housing stress?

Quite simply, households that are in housing stress are devoting a much larger fraction of their after-tax income to housing than those households not in stress. Those in housing stress therefore have less money left over for other essential items such as food, transport, health, utilities and education. These households’ ability to purchase non-essential items, or
luxury items, is very much compromised.

Who is experiencing housing stress?

Naturally, housing stress is most strongly felt by those buying a home (mortgagor) or those renting. Both tenure types have a high level of stress of around 30 per cent using the 30 only rule. However, nearly 1 in 10 buyer households spend at least half their after-tax income on housing. These households are at serious risk of financial difficulties, especially if family or economic circumstances were to change. Renters are the most prominent group (23 per cent) using the 30/40 rule and therefore the group where social costs are likely to be greatest. It is single persons and single parent households at greatest risk of living in housing stress. On the other hand, couples with children and couples without children barely rate a mention in the two more serious categories of stress. Arguably, couple with children households may be more disadvantaged than suggested as the income measure does not always take into account family size.

A breakdown of housing stress in Australia in 2011 is provided in Table 2. It shows that Sydney is the most stressed city on all measures used, with 9.4 per cent of Sydney households paying more than 50 per cent in housing costs, and 11 per cent of lower  income Sydney households paying more than 30 per cent. Tasmania and South Australia are the least housing stressed states. Of non-capital city areas, Queensland has the most housing stressed households. This may be related to the high demand for housing in the sea change areas of the Gold Coast and the Sunshine Coast where incomes of retirees may be quite low and with the mining boom in inner regional areas.


Generationally, it is the young who experience the most housing stress. Stress levels decline with age and we find that those over 65 years of age face very little housing stress. A concerning result is that First Home Buyers (FHBs) have by far the greatest stress of any group. Sixty per cent of FHB households pay more than 30 per cent of their after-tax income on housing. Seventeen per cent spend more than 50 per cent and 11 per cent fall into the 30/40 rule. This is the group that has been hit the hardest by the recent escalation in house prices. They have been forced to buy into a red hot housing market and crystallised the housing gains of the older generation.

The mortgages used by FHBs escalated over the past 10 years.

In 2001, the average loan by an FHB was just $131,000. By 2011 the average loan more than doubled to $280,000 however wages only went up by 38.8%.

Australian Bureau of Statistics (ABS) figures show that 15.7 per cent of housing loans in 2011 were provided to FHBs. This is much lower than the peak in 2009 of 28.5 per cent and last decade’s average of 19 per cent (ABS 2011a).

The typical FHB is also getting older. Larger mortgage requirements and a generation that’s delaying the responsibilities of life drives this ageing of FHB.  The age of FHBs is creeping up, in 2001, 39 per cent of FHBs were under 30 compared with 37 per cent in 2011. The property price boom of the last decade is transferring wealth from the younger generation to the older generation. Whether that wealth is one day returned to younger generations through larger inheritances remains to be seen.

International comparisons

Australia has one of the least affordable housing markets in the world. The 2011 International Housing Affordability Survey conducted in Australia, Canada, Ireland, Hong Kong, New Zealand, the United Kingdom and the United States showed that Australia was the second most expensive of these countries.

While not directly comparable with the results in this report, the survey showed that only Hong Kong was more unaffordable (Kotkin, 2011). That said, there are considerable difficulties in interpreting international house prices. The sort of housing available in each country differs tremendously. Some countries, like Australia and Hong Kong, are highly urbanised. Typically, urban areas are more expensive owing to greater job opportunities and a general preference for city life. Housing quality also varies greatly between countries, for example, in Australia, most housing has a large floor area and is detached while many other countries have much smaller housing that is either semi-detached (terraces/townhouses) or units. Regardless of the difficulties of international comparisons, housing in Australia is expensive compared with most other countries.


Conclusion

The previous decade witnessed a dramatic drop in Australian housing affordability.

Median house prices more than doubled to $417,000 while median after-tax incomes only increased by 50 per cent to $57,000. 

Australia now has amongst the most expensive property in the developed world. This report shows that this decline in affordability is all pervasive through Australia’s states and territories and major cities and towns.

Just 10 years ago, Australian housing was considered affordable. Australian housing is now severely
unaffordable.

If incomes continue to grow at the same rate as the past 10 years, it would take nearly 10 years of flat house prices for Australia to return to an affordable housing market.

In 2001, more than half the suburbs in our five major capital cities were rated as affordable. Today, only four per cent are affordable. Not a single inner city suburb is affordable. The impact of affordability is most strongly felt by those attempting to get into the housing market via the purchase of a home.

In summary, Australian house prices are simply so high that for many Australians the great Australian dream is just that - a dream. For those who do manage to purchase a house, high house prices mean taking on very high levels of debt that will constrain their lifestyle for many years into the future. Significant, widespread house price drops appear unlikely in Australia, meaning that housing will remain unaffordable for many years to come.

Source: AMP Housing Report