Friday, October 17, 2014

West Australian Housing Shortage Myth


So often we are told by "PROPERTY SPRUIKERS" house prices will "HAVE" to go up because we are not building anywhere near enough housing to keep up with demand & because of their "PERCEIVED" shortage house prices will keep rising as people have to have somewhere to live.

Gullible "Mum & Dad" PROPERTY SPECULATORS swallow this MANTRA dished out by these "PROPERTY SPRUIKERS" & continue to pay top prices for WA  housing thinking that the shortages are real.

Gullible Mum & Dad property Speculators rely solely on strong "Capital Growth" to offset negative rental returns. They believe the necessary "Capital Growth" they need for their Speculative Property Investment to work are there because there is a shortage of housing in WA but the reality is in fact very different.

You only have to attend any Property Seminar to  hear Property Spruikers go on & on about how big a  shortage there is & therefore Capital Growths are guaranteed.

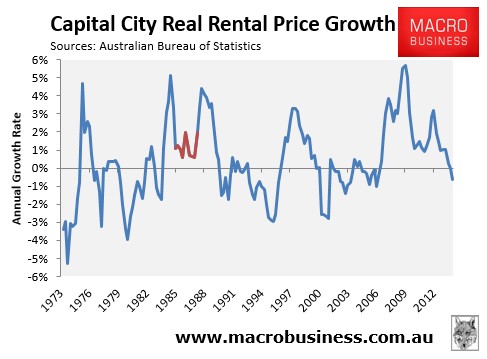
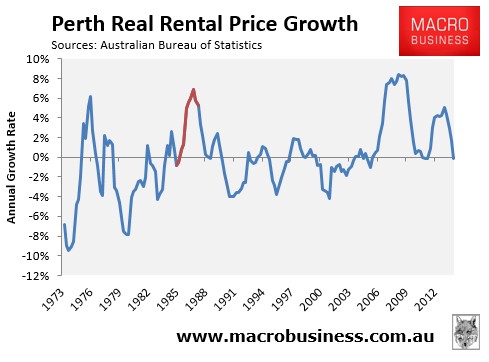
Below is a chart from www.macrobusiness.com.au that I borrowed to demonstrate that there is no shortage of property in WA & that in the last 30 years we have been building mor than enough to meet demand. In fact we built a SURPLUS of housing during this 30 year period.
(Note: I added the Grid lines to their chart to make it easier to follow)

The chart shows ABS Statistics on WA Housing Starts V's Population growth & the outcome might surprise some.

Further down I have broken down Population increase Vs Housing Completions  by years
(Note: my comparisons were with actual housing completion numbers & not just approval/planning numbers)

The years that I have compared (Every second year because that was easy to follow on the chart) shows that in only 4 out of the 17 years compared was there a shortfall in housing starts to population growth & one year where we built the exact amount of housing to match population growth. 

Now in the 17 years compared below taking away surplus from shortfall in WA we find that we built a 48,110 surplus of homes over & above what would be dictated by population growth. 

Now if you break it down to all the years over this period from the actual ABS Data you would find that in WA we have built 107,113 housing properties over & above demand based on population growth over this 30 year period.

So summing up if you look at the real ABS Data on WA Housing Builds Vs Population growth numbers you will find that in the last 30 years we have in fact built 107,113 homes over & above demand.  

So I wish Property Spruikers & Speculators the Best of Luck with your dreams of Capital Growths based on any shortages driving prices up.

Australian Census data has shown that on average over the last 30 years there has been 2.5 people per household.

In fact this number has been growing in recent years, because of the high cost of housing & rents, people have either been living at home with their parents longer or sharing longer with friends.Sharing or renting out a spare to friends has also become an economic necessity for many FHB just to enter the housing market.  But for the sake of this exercise lets use the long term average of 2.5 people per household.

With this in mind it would stand to reason that if the West Australian population increased by 25,000 people in a year we would need to build 10,000 new houses / units / apartments etc etc to accommodate this increased population.


1985 Population up 28,000 Homes built 18,000 enough to house 45,000 so we have a surplus of 6,800 Homes

1986 Population up 40,000 Homes built 16,000 enough to house 40,000 so we have a balanced supply & demand.

1988 Population up 45,000 Homes built 16,250 enough to house 40,625 so we have a shortfall of 1,750 Homes


1990 Population up 28,000 Homes built 20,000 enough to house 50,000 so we have a surplus of 8,800 Homes

1992 Population up 21,000 Homes built 16,000 enough to house 40,000 so we have a surplus of 7,600 Homes

1994 Population up 28,000 Homes built 23,000 enough to house 57,500 so we have a surplus of 11,800 Homes

1996 Population up 33,000 Homes built 15,000 enough to house 37,5000 so we have a surplus of 1,800 Homes

1998 Population up 29,000 Homes built 17,000 enough to house 42,500 so we have a surplus of 5,400 Homes

2000 Population up 27,000 Homes built 20,500 enough to house 51,250 so we have a surplus of 9,700 Homes

2002 Population up 21,000 Homes built 18,000 enough to house 45,000 so we have a surplus of 9,600 Homes

2004 Population up 28,000 Homes built 19,000 enough to house 47,5000 so we have a surplus of 7,800 Homes

2006 Population up 45,000 Homes built 23,000 enough to house 57,500 so we have a surplus of 5,000 Homes

2008 Population up 75,000 Homes built 22,000 enough to house 55,000 so we have a shortfall of 8,000 Homes

2010 Population up 55,000 Homes built 22,500 enough to house 56,250 so we have a surplus of 660 Homes

2012 Population up 89,000 Homes built 20,000 enough to house 50,000 so we have a shortage of 15,600 Homes

2013 Population up 65,000 Homes built 24,500 enough to house 61,250 so we have a shortage of 1,500 Homes


Oh & if you still think Perth Property will be OK or is Different this might come in handy 


Just a side note in many of the comments left here  I am often asked to explain where are all these empty houses if this was the case? .... 

Well lets look at the Department of Housing & Works they have 57.850 homes/units etc etc under their management yet at any given time there are over 8,000 of them vacant for various reasons...... 

Another area for vacant homes I discovered was the "Age Home" sector where there are thousands & thousands & thousands of elderly people living their last few years out with their family home vacant because they don't want to rent it out to strangers & have it trashed & besides whats the rush to sell after all they are going up in price more than their holding costs & if sold in a few years after Nanna passes away more money to share with those left behind & after all it would be too upsetting to sell Nannas home whilst she is alive & confirm to her she is never coming back.

Comments / Questions / Suggestions good or bad always welcome as usual.

Sunday, October 12, 2014

Investors Block out First Home Buyers

Another article by Leith van Onselen @ Macro Business that I thought worth sharing.

I don't know about elsewhere but Perth rents are on the decline & vacancy rates are rising. Sooner or later investors will wake up & realise the capital growths of the past  cant be sustained because significant parts or the market (FHB) are priced out because they themselves have inflated prices beyond their reach.
 

By Leith van Onselen
Things have gone from bad to worse for Australia’s first home buyers (FHBs), with Friday’s housing finance data for August, released by the Australian Bureau of Statistics (ABS), revealing record investor mortgage demand amidst the share of loans to FHBs falling to an all-time low.
According to the ABS, the value of investor mortgages hit a record $127.4 billion in the year to August 2014, up 29% on the year to August 2013, with the share of mortgages (excluding refinancings) going to investors also hitting a record high 47.4% over the year (see next chart).
ScreenHunter_4451 Oct. 13 07.53
Meanwhile, the number of FHB mortgages slumped by 13.0% in the year to August 2014, with the share of mortgages to FHBs also declining to a record low 11.8% (see below charts).
ScreenHunter_4452 Oct. 13 07.58
ScreenHunter_4453 Oct. 13 07.58
The next chart summarises how investors continue to crowd-out FHBs, with an obvious inverse relationship existing between the two buyer cohorts:
ScreenHunter_4454 Oct. 13 08.01
Essentially, property investors are gorging themselves whilst Australia’s FHBs watch from the sidelines, starving.
unconventionaleconomist@hotmail.com
www.twitter.com/leithvo

Tuesday, August 19, 2014

Negative Gearing Myth's Pushed By Spruikers & REIA

Another Great Article worth sharing


By Leith van Onselen
Repeat a lie often enough and it becomes true. This appears to be the approach taken by the Real Estate Institute of Australia (REIA), which has issued yet another warning that the removal of negative gearing would adversely harm Australia’s renters by creating rental shortages and driving-up rents. From Residential Property Manager:
REIA chief executive Amanda Lynch said the federal Treasury is again pushing for the removal of negative gearing and the rumour is that modelling will be done on retaining it for new housing only.
“This is a serious threat not only for our profession and geared investors but potentially for all property owners,” she said.
“Negative gearing increases investment supply with almost 1.9 million of Australians investing in the residential property market.
“The arrangement keeps rents lower than they otherwise would be,” she added.
The Hawke government abolished negative gearing for property in 1985, only to have it reinstated in 1987.
According to the REIA, during that period rents increased by 57.5 per cent in Sydney, by 38.2 per cent in Perth and by 32.0 per cent in Brisbane, highlighting the importance of upholding the arrangement…
“In the current tight rental market expectations are for outcomes similar to the mid-1980s,” Ms Lynch said
“The removal of negative gearing would increase demand for social housing, an area that governments have been struggling to address.”
Once again, let’s use something called “evidence” to debunk the REIA’s claims that the quarantining of negative gearing between 1985 and 1987 pushed-up rents.
First, consider the below chart plotting the Australian Bureau of Statistics (ABS) rental series from 1972 in real (inflation-adjusted) terms, with the period where negative gearing losses were quarantined (i.e between June 1985 and September 1987) shown in red.
ScreenHunter_3791 Aug. 15 11.02
As you can see, there was nothing spectacular about this period, with periods of higher rental growth recorded both prior and subsequently.
Now let’s examine each capital city housing market to see whether the quarantining of negative gearing had any discernible impact on rents.
ScreenHunter_3798 Aug. 15 11.12
Now Melbourne:
ScreenHunter_3799 Aug. 15 11.12
Brisbane:
ScreenHunter_3800 Aug. 15 11.12
Perth:
ScreenHunter_3802 Aug. 15 11.14
Adelaide:
ScreenHunter_3801 Aug. 15 11.12
Hobart:
ScreenHunter_3803 Aug. 15 11.15
Canberra:
ScreenHunter_3804 Aug. 15 11.15
Darwin:
ScreenHunter_3805 Aug. 15 11.16
Again, anyone that claims that the quarantining of negative gearing between 1985 and 1987 pushed-up rents either doesn’t know what they are talking about, or is lying. The above charts illustrate, without a shadow of a doubt, that the Hawke Government’s decision to quarantine negative gearing had no discernible impact on rental growth, period.
The REIA’s tacit assertion that negative gearing assists in the provision of rental accommodation is also highly spurious. An examination of of the RBA statistics shows that the overwhelming majority of investors – over 90% – invest in existing dwellings rather than construction, and that the proportion of investors constructing dwellings has fallen spectacularly since negative gearing was re-introduced in September 1987 (see next chart).
ScreenHunter_3329 Jul. 16 11.35
Moreover, the amount of investor funds going into new construction has barely shifted in 25 years:
ScreenHunter_3330 Jul. 16 11.36
Because investors primarily purchase existing dwellings, negative gearing in its current form simply substitutes homes for sale into homes for let. As such, negative gearing has done little to boost the overall supply of housing or improve rental supply or rental affordability.
In the event that negative gearing was quarantined so that losses could no longer be claimed against wage or salary income (as occurred between 1985 and 1987) and a proportion of investment properties were sold, who does the REIA think they would sell to? That’s right, renters (or other investors). In turn, those renters would be turned into owner-occupiers, thereby reducing the demand for rental properties, leaving the rental supply-demand balance unchanged.
Let’s also not forget that Australia is one of only a few nations that allow investors to deduct property losses against unrelated income. And yet we have one of the most unaffordable housing markets in the world and chronic supply problems (despite a massive land mass). What does this tell you about the efficacy of retaining negative gearing?
The evidence shows that negative gearing does little to boost supply, yet the additional demand from tax subsidised investors places upward pressure on home prices, locking-out first time buyers. This might help to explain why most other nations – many with more affordable rental accommodation than Australia – do not allow negative gearing.
Negative gearing also costs the government billions in lost tax revenue, which could be used to fund schools, hospitals, housing-related infrastructure, or any number of other worthwhile endeavours. It is pure and simple rent-seeking.

Monday, July 21, 2014

Barefoot Investor Email

Below is a email sent out by Scott Pape (Barefoot Investor & Channel 7 Finance commentator) Makes some interesting points about Renting V's Buying, but also an interesting observation about how anyone who is critical of buying housing is attacked by Spruikers......


G'day .....,

 
I copped a bit of hate mail this week.

My crime?

I got on the telly and talked about a new report that suggested it was better to rent than buy.

Cue the crazies: there’s a lot of emotion when it comes to buying property. I think of it as a slightly less bogan version of the rivalry between Holden and Ford (or Kim and Kanye) and this week I managed to get both sides’ back up.

However, I was trumped by the normally poker-faced boffins at the Reserve Bank of Australia (RBA). They rarely speculate on where house prices are going — they don’t have to, they influence prices by setting interest rate policy.

Yet this week the RBA released research that found that over the past 60 years there wasn’t much of a difference between renting and owning.

Okay, go back and read that last sentence again, just so you take it in. It sounds like bulldust, right?

After all, we’ve just lived through the mother of all housing booms — in which your parents bought their home 30 years ago for the cost of a Kia Rio and it’s now worth the same as a Rolls-Royce Phantom.

What gives?

Well, it all comes down to the costs of home ownership, which I’ll tackle in a moment (send your hate mail to scott@barefootinvestor.com). Yet the most intriguing part of the study was the RBA researchers suggesting that if property prices slow, “the average homebuyer would be financially better off renting”.

Boo-yah.

Reading between the lines, that’s a warning shot. The boffins are telling first home buyers to curb their expectations about the future riches they should expect from buying a bunch of bricks.

But let’s get back to the hate mail.

Renting Your Way to Riches

On the telly I interviewed one of Australia’s most respected and successful economists, Phil Ruthven, founder and chief of IBISWorld.

Ruthven’s a man of extraordinary intellect and insight, but what makes him especially interesting is that he made a conscious decision to rent his home.
Years ago he crunched the numbers and worked out he’d be streets ahead by selling his home and renting instead.

And here’s the kicker: Ruthven isn’t a doom and gloom merchant on property. (In fact, Ruthven is more optimistic about the future of property prices than I am.)

The reason Ruthven believes home ownership is a dud deal is because of the significant costs. He argues that rent money may well be dead money, but so too is interest.

Let’s say Phil saves up a $50,000 deposit and buys a $550,000 home. He takes out a $500,000 home-loan over 25 years and pays a (long-term average) 7 per cent interest rate.

Over the next 25 years he’ll end up paying more money in interest to the bank than he’ll pay to actually buy the home: the total repayments will be $1.06 million, including a whopping $563,000 in non-tax-deductible interest.

And it gets worse. That figure doesn’t factor in the significant out-of-pocket costs homeowners pay. It begins with stamp duty and legal fees, continues with the wear and tear on the property (which works out long term to be around 5 per cent of the value of the property each year) and ends with the selling costs.

On Ruthven’s calculations, if you were to buy an average home for $550,000, fifteen years later you could expect to sell it for a $350,000 profit -- after stripping away your many start-up, ongoing and selling costs. However, if you rented a similar home and invested the same amount in the share market, you’d come out with a $1.25 million profit over the same period.

Now before you get too carried away and rush out to sell your house, consider this: in all my time of being Barefoot I know only one person who has actually done this — Phil Ruthven.

For the rest of us, buying a home isn’t just a financial decision, it’s an emotional one. After all, it’s a place where you raise your family. It’s your castle. Personally, buying my first little apartment was one of the proudest moments of my life — and it beat the pants off any win I’ve ever had in the share market.

Kicking the Buckets

Let’s be honest: all forecasts on future prices are a guess — no-one has a crystal ball — but everyone has an opinion. Here’s mine.

As a (relatively) young person buying into one of the most expensive property markets on the planet, I went in with my eyes wide open: the last 20 years of boom-time gains are unlikely to match those of the next 20.

That’s because there was a significant structural shift that caused prices to boom: the banks were deregulated in the mid-80s, which led in part to the biggest borrowing binge in history. That ‘Get Out of Jail Free’ card has already been played by the Baby Boomers and I’m on the wrong side of the boom.

Either way, I’m a strong believer in home ownership, for all the reasons I’ve already listed. But here’s the real point: I’m wary of having all my eggs in the one basket — or bucket.

That’s why my wealth-building strategy focuses on dividing my income into three separate wealth buckets: a Blow Bucket (for daily expenses and mortgage repayments), a Mojo Bucket (for emergencies) and a Grow Bucket (for wealth-building through the share market).

Phil might argue that I’m getting a dud deal, but I see it as the best of both worlds.

Tread Your Own Path!

Wednesday, June 11, 2014

IMF says our Housing Costs Are Out Of Wack

Interesting story in The Australian 12-06-2014


House prices to income ratios.
House prices to income ratios. Source: TheAustralian
 
HOUSING is less affordable in Australia than in any other country except Belgium, the International Monetary Fund says, warning that rising prices might point to an unsustainable boom. 

The IMF is stepping up its analysis of housing markets around the world, having concluded that property booms and busts were implicated in two-thirds of the past 50 banking crises. “The era of benign neglect of housing booms is over,” deputy managing director Min Zhu said.

House prices, rents and incomes should, in theory, all move in tandem.

On this basis, the Australian real estate market is one of the most exposed in the world.

The ratio of prices to individual incomes is one-third more than its long-term average, the IMF estimates.

Canadian house prices are similarly inflated, while prices in Belgium are almost 50 per cent higher, relative to incomes, than average.

“In the long run, the price of houses cannot stray too far from people’s ability to afford them,” the IMF says. 

If ratios between house prices and rent get too far out of line, people will switch between buying and renting, eventually bringing the two into balance, it notes.

Presently, the ratio between house prices and rents is 50 per cent more than the long-term average in Australia.

Such indicators provide only a broad indication of housing market valuations, with issues such as credit growth, household indebtedness and the nature of housing finance in a country also having an effect.

The fund says there is no single indicator for when a housing market is set for a fall but if a range of indicators, such as credit growth and housing affordability, are all pointing to an overheated market, authorities should take action.

The IMF argues for regulatory intervention to slow house price booms, such as demanding that banks hold more capital against any housing loans, or imposing limits on how much people can borrow against the value of their house or their income.

The Reserve Bank has been sceptical about these strategies, arguing that regulation has limited effectiveness. If interest rates are too low, people will find ways to borrow excessively.

Monday, May 26, 2014

What We Earn is Not So Great Compared To What We Pay

Saw another great article on Microbusiness site that I thought was worthwhile sharing.

By Ross Elliott, author of The Pulse

Discussions about housing affordability focus almost exclusively on the price of the real estate, movements in which are monitored by multiple organisations on a seemingly daily basis. There is comparatively little discussion about people’s incomes, which are equally as important as prices in determining what can and can’t be reasonably afforded. The income profile of what most Australian’s actually earn paints a sobering picture which could more often be taken into account in debates about housing and affordability.

It’s becoming fashionable again for business lobbies to complain about Australia’s high wage structure. It explains, they’ll argue, why we lost Holden, Ford, Toyota, and (almost) Qantas, among other things. And yes, Australia’s wages are high by competitor standards – but so are our costs. One of the most fundamental of needs, along with food and clothing, is shelter. And it’s the cost of shelter relative to incomes which has been stretched to beyond reach for a large proportion of young Australians.

Reducing minimum wages or reducing wage growth further, if at the same time allowing housing costs to further escalate, will only make this situation worse. Arguably, if we could substantially reduce the cost of supplying new housing, this would relieve upward pressure on wages and work towards improving our global competitiveness – along with repairing living standards for working and middle class families, rather than eroding them.

First, here are some of the facts on the infrequently discussed income side of the equation. (I am again indebted to the team at Urban Economics for making these available. These are top line numbers only: if you want more detailed analysis, please contact Kerrianne Bonwick).
Nearly two in three of all Australians earn less than $52,000 per annum. It doesn’t much matter whether it’s Brisbane, Sydney or Melbourne; the proportion is roughly the same. It’s not much. Slightly more than another one in every eight earn from $52,000 to $78,000 per annum. Roughly eight in ten Australians earn less than $78,000 per annum.

ScreenHunter_2558 May. 23 10.38

Problem? It is if you’re trying to buy into the housing market. Take a modest house of say $400,000 (very modest depending on location). A worker on $50,000 – and these represent nearly two thirds of all workers remember – is facing a price multiple which is 8 times their gross pre-tax income.

Basically, two thirds of us are stuffed in terms of affording even a modest $400,000 property if we weren’t already in the market. A more reasonable price multiple of say 5 times income would require an income of $80,000 per annum or more. But there are less than 15% of Australians who fit this category.

But wait, shouldn’t we count household, as opposed to personal, incomes? A good point, particularly for younger families and young couples, where dual incomes are the norm due to necessity.
But even based on combined household incomes, a third of all households earn less than $52,000 per annum. Another 14% to 15% earn between $52,000 and $78,000 and another 11% or 12% earn between $78,000 and $104,000. A reasonably healthy 30% of all households bring in a combined $104,000 per annum or more, but seven in ten bring in less than that.

Taking our modest $400,000 home again, and roughly half of all household incomes fall short of the $80,000 mark required for a price-to-income multiple of five. For one in three of every households, their combined income means a price to income multiple of eight times. They are pretty much stuffed, still.

ScreenHunter_2559 May. 23 10.40


Hang on, isn’t it more relevant to focus on the demographic that’s more likely to be trying to get into the property market, because older people and retirees, who already own or are paying off homes, may skew the figures? Absolutely: this is the key demographic, especially if you’re a developer of new detached housing product – which is what this cohort mainly wants to buy to raise a family in (as opposed to the apartment they might rent while pre-children).

Personal income profiles of the 25-34 year old age group are pretty much in line with the Australia wide picture. More than half earn less than $52,000 and roughly eight in ten earn less than $78,000 per annum, which means eight in ten of this age group – who are at the peak of their family formation potential – would be faced with a price multiple of more than 5 times incomes on a $400,000 property, and more than half would be faced with a price multiple which is eight times their income, or more.

ScreenHunter_2560 May. 23 10.41

None of this is great news. For developers trying to provide affordable new housing in new greenfield estates in urban fringe locations, the reality of these income profiles can’t be escaped. I had the privilege of visiting one such estate in south east Queensland recently and what I saw was absolutely first class product at very good entry level prices in a very well designed environment. No ‘McMansions’ here – just quality new detached three and four bedroom homes, on small lots, priced from around $350,000 – and in some cases less.

But even at $350,000, only around 15% or so of the target 25 to 34 year old demographic could afford to get in with a price multiple of less than 5 times an individual’s income. That proportion would rise taking into account combined incomes for this age group, but it won’t rise beyond around a quarter or a third. The reality is that more than half this age group would find an entry level $350,000 home would be six times their combined incomes or more. It would be tough going.
Granted, interest rates are currently very low and some governments are offering stamp duty and other concessions to first time buyers. But these are having next to no impact on this market. Rates of first home buyer activity are at generational lows. And interest rates won’t stay this low forever. A significant rise in variable home loan rates could tip a substantial number of families in this age group from the ‘just making it’ basket into the ‘we’re stuffed’ basket.

Since the ‘do nothing’ policy approach doesn’t seem to be working, what could be done to turn the situation around? Basically, it’s a simple formula between incomes and prices. You either increase incomes or reduce prices. The first probably isn’t an option unless incomes can gradually creep up with inflation and with productivity gains over time.

But what could also happen is the cost of supplying new housing (not referring to existing stock) could be reduced. New housing is heavily taxed and over regulated (the same cannot be said of existing stock). Something like a quarter to a third of the cost of the new home in an urban fringe location is due entirely to various taxes, charges and compliance costs (which do not apply to existing stock). It is also affected by the rapid escalation in land costs due to policy induced supply constraints in areas of ample available land (the same can’t be said of existing stock in mostly built-out inner or middle ring areas). Most of these additional costs of supply owe themselves to policy changes made since the early 2000s – precisely the time when the affordability gap began to widen. It does seem a compelling place to start.

We should aspire to a more competitive Australia but this policy effort cannot just focus on labour costs because our incomes, while high by competitor standards, are now generally insufficient to cover one of the basic necessities of life: shelter. We have made this happen because policy makers have deliberately increased the cost of delivering new housing with new taxes, charges and compliance costs, all justified on esoteric planning or sustainability principles but impossible to justify on social equity or economic grounds.

These policy changes were made to suit political agendas at the time: they were not needs-based or market-based policy changes. (It also has to be said the political agendas at the time were in the hands of Labor State governments, starting with Bob Carr in NSW but which spread rapidly to other jurisdictions. Why Labor Governments introduced policies which hurt people on working wages is as mystifying to me as why Liberal Governments have continued to maintain the same policy positions, with little amendment).

The gap between the cost of supplying even relatively basic housing on the urban fringe, and the incomes of the people who in past generations could afford it, will continue to widen unless regulators and policy makers begin to grasp the wider economic consequences of policy-inflated costs for new housing supply.

Footnote: why a five times multiple? There is no strong reason. The authors of the global housing affordability report Demographia will argue that affordable housing should be around three times incomes. Moderately unaffordable they define as between 3 and 4, and between 4 and 5 is defined as ‘seriously unaffordable.’ The multiples of 7 or 8 times incomes, which we’re seeing in Australia, are off the scale. But for the purpose of argument, if even relatively high (by international standards) multiples of 5 times incomes seems like a utopian dream, it illustrates how far incomes need to rise or costs of new supply should fall before we get even close to the situation that prevailed for most of our history. It’s a big challenge.

Tuesday, February 11, 2014

The cold truth about hot property prices

Another great article on Property prices that I came across well worth a read.

The cold truth about hot property prices


Job security may be of increasing concern for many Australians, but you would never know it looking at investor activity. Has there ever been a greater divide between the outlook for prospective home buyers and investors?
First home buyers may be pessimistic but the investor-fuelled housing boom continued to roll on in December. It was business as usual, with the value of housing loans to investors rising by 2.9 per cent in December to be more than 40 per cent higher over the year.
The increase in investor activity, particularly in New South Wales, has been largely unprecedented in Australia, with lending well above its historical levels. Owner-occupier activity on the other hand has increased significantly, but is still well below prior peaks when you consider population growth.

Graph for The cold truth about hot property prices
A leading reason for this is that first home buyer activity remains at an exceptionally low level. Despite historically low mortgage rates – which have prompted investor speculation – the benefits have not accrued to prospective homeowners.
Renters are more concerned with job security than leveraging up during uncertain times. And who could blame them, particularly with full-time employment declining over the past year? I would go so far as to say that the Australian labour market hasn’t been this weak in over a decade (There’s no silver lining in Australia’s ageing labour market, January 16).
In such an environment, how long can this housing boom last? That is always difficult to pinpoint but it is disconcerting to note that owner-occupiers also appear to be becoming a little less optimistic. The number of loan approvals by existing homeowners has slowed across most states in recent months, in sharp contrast to investor activity.

Graph for The cold truth about hot property prices
What should be clear is that the current make-up of Australian lending is not conducive to sustainable house price growth. Investors are notoriously fickle and, if their optimism fades, then the market will turn – and quickly.
Compounding matters is that Australian housing hasn’t exactly been a great investment in recent years. Sydney house prices, for example, have increased by 0.8 per cent over the past decade after accounting for inflation. Real prices have declined in Perth over the past seven years.
Even Melbourne, the best-performing housing market since the onset of the global financial crisis, has offered only a modest return on investment since 2008.

Graph for The cold truth about hot property prices
How long can investors ignore the fact that Australian housing has not offered more than a short-term speculative profit in years? And when they do, what will happen? Similar profits could be obtained with term deposits. Surely there are overseas property markets that offer superior returns if property investment is your thing.
No one can pinpoint the exact moment that Australia’s $5 trillion housing market will slow. Speculators who think they can are playing a pretty risky game.
A decade ago, the Sydney market showed what could happen when a market becomes completely dominated by investors at the expense of other home buyers. When investor optimism subsided in 2004, it took a decade for Sydney's real house prices to return to their peak. That may not happen again, but it should provide a sober reminder than housing investment isn’t always a good investment.
Low interest rates will continue to support the Australian housing market but it has become increasingly obvious that the current housing boom is being driven by unsustainable speculative activity.
In the long run, house prices will be driven by labour market conditions and demographic changes – two factors that are set to work against house price growth. How long will it take investors to cotton on to the fact that Australian housing has not been a great investment in years?

Sunday, January 19, 2014

Saul Eslake Slams Australian Housing Policy.

 Another great article on Housing Policy gone wrong in Australia well worth a read to understand the real issues impacting housing affordability.

Saul Eslake slams Australian housing policy

ScreenHunter_924 Jan. 20 12.17
By Leith van Onselen
The AFR is today reporting that Saul Eslake, who has held multiple chief economist roles at various banks, as well as acted on the National Housing Supply Council, has provided a personal submission to a Senate Inquiry into Affordable Housing.  The submission, entitled ‘50 years of failure’, provides a damning assessment of Australian housing policy, claiming that government self interest has led to the worst affordability problem since the end of World War II:
“Politics – more than any other single factor – means that Australians are likely to have to live with a dysfunctional housing system for a long time yet to come,” Mr Eslake said.
Government policies including cash assistance to first-time home buyers and negative gearing had only served to inflate the demand for housing whilst doing next to nothing to increase the supply and therefore made affordability worse, he said…
While political parties and governments professed to care about first home buyers, the reality was that they preferred to garner the votes of the 5.8 million households who sought policies that would increase house values.
Presumably, Mr Eslake’s submission to the Senate Inquiry is the same one as presented to the 122nd Annual Henry George Commemorative Dinner, hosted by Prosper Australia, last September. This presentation was summarised on this blog, and below are extracts taken directly from that post explaining Eslake’s position.
________________________________________________________________________________________
Consider the next chart showing how the home ownership rate has decreased over the past 50 years, despite the massive decline in interest rates and subsidies to first home buyers (FHBs):
ScreenHunter_39 Sep. 03 10.37
Moreover, home ownership has fallen across all age cohorts, although the decline has been particularly severe amongst younger cohorts:
ScreenHunter_40 Sep. 03 10.40
According to Eslake:
…the decline in home ownership has been even more pronounced when one ‘looks through’ the effects of the ageing of the population, which (among other things) means that an increasing proportion of the population is within age groups where home ownership rates are always (and for obvious reasons) higher than in younger age cohorts…
Research by Judy Yates of the University of NSW shows that home ownership rates among younger age groups declined dramatically between the 1991 and 2011 Censuses – from 56% to 47% among 25-34 year olds; from 75% to 64% among 35-44 year olds; from 81% to 73% among 45-54 year olds; and 84% to 79% among those over 55…
This is also evident in the fact that home owners are taking longer to pay off their mortgages. According to the ABS’ just-released Survey of Housing Occupancy and Costs (ABS 2013b), only 45.8% of home-owning households owned their home outright in 2011-12, compared with 58.5% in 1994-95.
Eslake also showed how the supply of housing has become increasingly constipated since the 1990s in the face of rising demand, in concert with urban containment policies by Australia’s various state and territory governments:
…between 1976 and 1991, the housing stock increased at a much faster rate – 41% – than the population – 23% – although only 9% of dwelling completions during this period were by the public sector.
But the relationship between growth in the housing stock and population growth began to change after the early 1990s. Between 1991 and 2001, Australia’s population grew by 11.5%, while the housing stock grew by only 18.3% – less than 9 pc points more than the population.
And between 2001 and 2011, while the population grew by 15.9%, the housing stock grew by only 15.2%. That is, over the past decade, the housing stock has grown at a slower rate than the population – for the first time since the end of World War II.
This gradual narrowing in the ‘gap’ between the growth rate of the housing stock and that of the population – to the point of eliminating it entirely over the past decade – has come in the face of demographic trends that would have warranted a widening of this gap:
  • average family sizes declined between the early 1960s and the early 1990s, implying that more dwellings are required to accommodate the same number of people;
  • family breakdowns have meant that more dwellings are required to accommodate the same number of people; and
  • population ageing has resulted in more people living alone, again increasing the number of dwellings required to accommodate the same number of people.
Yet, in the face of these ongoing trends, the average number of people per dwelling actually rose (from 2.61 to 2.64) between the 2006 and 2011 Censuses – for the first time in at least 100 years (since the first Commonwealth Census was conducted in 1911 – see Chart 3). From 1911 to 2006, the average number of people per dwelling had fallen from 4.52 to 2.61. It would seem that the widespread angst among ‘baby boomer’ parents about how difficult it is to get their 20- (and in some cases 30-) something children out of the family home has a sound basis in fact.
ScreenHunter_41 Sep. 03 10.49
Eslake puts the recent failure of housing supply to keep up with demand down to two main factors, namely:
  • The decline in the provision of social housing; and
  • Restrictive state and local government planning schemes and upfront charging for development and infrastructure.
Eslake is particularly scathing of policies that boost demand, such as FHB Grants and negative gearing.
FHB Grants began in the 1960s and have been cancelled and then re-introduced a number of times ever since. According to Eslake, governments have spent a total of around $22.5 billion in grants in 2010-11 values over the past 50 years, yet homewonership rates have not increased over this period. They provide minimal benefit to FHBs, acting to inflate values for the benefit of vendors. In this regard, they have been a massive failure, although the recent shift towards newly constructed dwellings is a significant policy improvement.
ScreenHunter_42 Sep. 03 11.01
On negative gearing, Eslake noted that it has “actually exacerbated the mis-match between the demand for and the supply of housing, as well as having distorted the allocation of capital, and undermined the equity and integrity of the income tax system”.
Australia is one of only a few developed nations that allow negative gearing, which was made all the worse by the Howard Government’s 1999 decision to tax capital gains at half the rate applicable to other income (instead of taxing inflation-adjusted capital gains at a taxpayer’s full marginal rate). Thus negative gearing became “a vehicle for permanently reducing, as well as deferring, personal tax liabilities. And the availability of depreciation on buildings adds to the way in which ‘negative gearing’ converts ordinary income taxable at full rates into capital gains taxable at half rates”. As such, it has also become increasing popular:
ScreenHunter_43 Sep. 03 11.06
Eslake sees no policy rationale for negative gearing. It costs taxpayers a fortune – roughly $5 billion in revenue foregone. It does nothing to increase the supply of housing – “92% of all borrowing by residential property investors over the past decade has been for the purchase of established dwellings, as against about 72% of all borrowing by owner-occupiers”. It increases investor demand and prices. And it does nothing to improve rental availability or affordability.
As for common arguments in favour of negative gearing:
Supporters of ‘negative gearing’ argue that its abolition would lead to a ‘landlord’s strike’, driving up rents and exacerbating the existing shortage of affordable rental housing. They repeatedly point to what they allege happened when the Hawke Government abolished negative gearing (only for property investment) in 1986 – that it ‘led’ (so they say) to a surge in rents, which prompted the reintroduction of ‘negative gearing’ in 1988.
This assertion is actually not true. If the abolition of ‘negative gearing’ had led to a ‘landlord’s strike’, as proponents of ‘negative gearing’ repeatedly assert, then rents should have risen everywhere (since ‘negative gearing’ had been available everywhere). In fact, rents (as measured in the consumer price index) only rose rapidly (at double-digit rates) in Sydney and Perth – and that was because in those two cities, rental vacancy rates were unusually low (in Sydney’s case, barely above 1%) before negative gearing was abolished. In other State capitals (where vacancy rates were higher), growth in rentals was either unchanged or, in Melbourne, actually slowed (see Chart 7).
ScreenHunter_44 Sep. 03 11.12
However, notwithstanding this history, suppose that a large number of landlords were to respond to the abolition of ‘negative gearing’ by selling their properties. That would push down the prices of investment properties, making them more affordable to would-be home buyers, allowing more of them to become home-owners, and thereby reducing the demand for rental properties in almost exactly the same proportion as the reduction in the supply of them. It’s actually quite difficult to think of anything that would do more to improve affordability conditions for would-be homebuyers than the abolition of ‘negative gearing’.
Eslake also notes that there is no evidence to support the claim that negative gearing results in more rental housing being available that would otherwise be the case:
Most other ‘advanced’ economies don’t have ‘negative gearing’: yet most other countries have higher rental vacancy rates than Australia does.
ScreenHunter_45 Sep. 03 11.15
In the United States, which hasn’t allow ‘negative gearing’ since the mid-1980s, the rental vacancy rate has in the last 50 years only once been below 5% (and that was in the March quarter of 1979); in the ten years prior to the onset of the most recent recession, it has averaged 9.1% (see Chart 8 above).
Yet here in Australia, which does allow ‘negative gearing’, the rental vacancy rate has never (at least in the last 30 years) been above 5%, and in the period since ‘negative gearing’ became more attractive (as a result of the halving of the capital gains tax rate) has fallen from over 3% to less than 2%.
During that same period, rents rose at rate 0.8 percentage points per annum faster than the CPI as a whole; whereas over the preceding decade, rents rose at exactly the same rate as the CPI.
Similarly, countries which have never had ‘negative gearing’ – such as Germany, France, the Netherlands, the Nordic countries and (low-tax) Switzerland – have much larger private rental markets than Australia.
Eslake also debunked claims that removing negative gearing would create distortions in the tax system:
Some supporters of negative gearing also argue that since businesses can deduct all of the operating expenses they incur (including interest) against their profits in order to determine their taxable income, and can also ‘carry forward’ net losses incurred in any given year against profits earned in subsequent years so as to reduce the tax otherwise payable, it is only ‘fair and reasonable’ that investors should be able to do the same.
There are two flaws in this argument, in my view. First, a large part of the appeal of ‘negative gearing’ comes from the way in which it allows income which would otherwise have been taxed at the investor’s marginal rate effectively to be converted into capital gains, which are taxed at half the investor’s marginal rate. Businesses – if they are incorporated, as most businesses these days are – can’t do that. Companies aren’t eligible for the 50% discount on tax payable on gains on assets held for more than one year.
Second, while individuals are allowed to deduct expenses incurred in connection with producing investment income from their taxable income, they aren’t allowed to deduct many types of expenses incurred in producing wage and salary income.
To take an obvious example, wage and salary earners aren’t allowed to deduct the cost of travelling to and from work; nor are they allowed to deduct child care expenses.
Or, to take another example which may be an even closer analogy with ‘negative gearing’ for investment purposes, individuals aren’t allowed to deduct interest on borrowings undertaken to finance their own education as a tax deduction, even though that additional education may contribute materially to enhancing their future earnings – and even though any such additional future earnings will be taxed at that individual’s full marginal rate, as opposed to half that rate in the case of capital gains on an investment asset.
Finally, Eslake finished by offering seven key policy reforms to improve the functioning of the housing market:
The fundamental change that such a set of policies might embody would be a switch from policies which inflate the demand for housing to policies which boost the supply of housing. Such a suite of policies might include some or all of the following.
First, the abolition of all existing policies which serve only to increase the prices of existing dwellings, such as cash grants to and stamp duty exemptions for first time buyers, and ‘negative gearing’ for investors (in all assets, not just property, and if politically necessary, only for assets acquired after the date on which such a policy was announced);
Second, the redirection of the funds thereby saved (and/or the additional revenue raised) towards programs that increase the supply of housing – for example, by directly funding the construction of new dwellings (as the Rudd Government did as part of its response to the global financial crisis), or by providing some combination of grants, loans or tax incentives to induce private sector developers to increase the proportion of ‘affordable’ dwellings within their developments, whether for sale or rental;
Third, expanding or replicating programs like Western Australia’s ‘Keystart’ scheme which assist eligible people to become home owners on a ‘shared equity’ basis, with eligibility being subject to a means test, and which creates a ‘revolving fund’ as the ‘shared equity’ is returned to the State Government upon sale;
Fourth, changes to the way in which State and Territory Governments tax holdings of and transactions in land, with a view to encouraging more efficient use of it. That would include replacing stamp duty on land transfers (which are ‘bad’ taxes on many grounds, including that they discourage people from changing their dwellings as their needs change) with more broadly-based land taxes (ie, no exemptions for owner-occupiers, but with appropriate transitional provisions) and possibly higher rates for undeveloped vacant land in established urban areas;
Fifth, taking a more ‘holistic’ view of urban infrastructure investment, by recognizing that it has an important housing dimension – that is, that public (or private) investment in transport infrastructure (both public transport and roads) can make a tangible contribution towards improving housing supply and affordability by making ‘greenfields’ developments more accessible to both buyers and renters – and considering funding such infrastructure by levies on the increments to the value of the land which result from such investments (as for example with the levy that funded the Melbourne Underground Rail Loop Authority in the 1970s and early 1980s);
Sixth, revisiting current models for financing the provision of infrastructure and services in ‘greenfields’ housing estates with a view to reducing the extent to which these are funded by ‘upfront’ charges (something which could be assisted by changes to the land tax regime which I mentioned a moment ago); and
Seventh, reducing the cost, complexity and regulatory uncertainty associated with ‘brownfields’ and ‘infill’ developments in established areas – which doesn’t have to mean traducing the property rights of other property owners, but which should mean clearer and more uniform planning rules, with fewer opportunities for frivolous or vexatious objections and appeals.
unconventionaleconomist@hotmail.com